
Overview tab
At-a-glance system and e-commerce metrics for a single environment, streaming live via WebSocket.
The Overview tab is the first thing you see when you click into an environment. It is the at-a-glance summary — current health and recent activity in one view, split into two metric panels.
System metrics
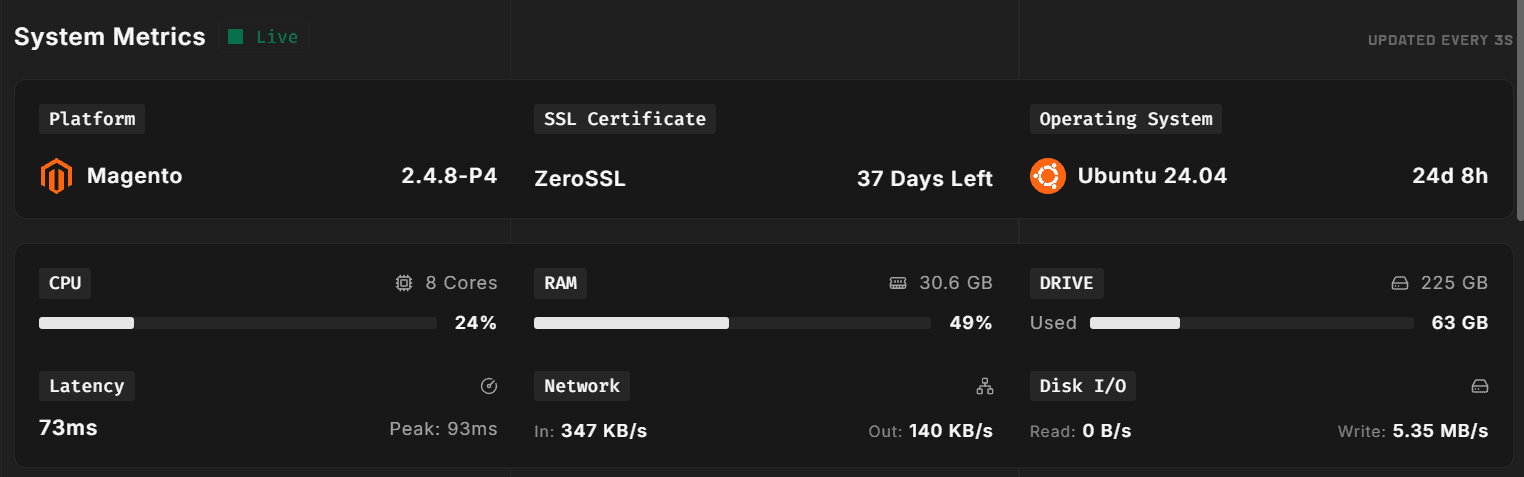
The System Metrics panel refreshes approximately every 3 seconds. It shows:
- CPU current utilization
- Memory used vs total RAM
- Disk storage utilization
- Network I/O inbound and outbound throughput
- Latency measured response time from the VM
Data comes from the platform agent, which runs directly on the VM host. It runs outside the Docker stack so it captures host-level resource usage rather than per-container figures.
E-commerce metrics
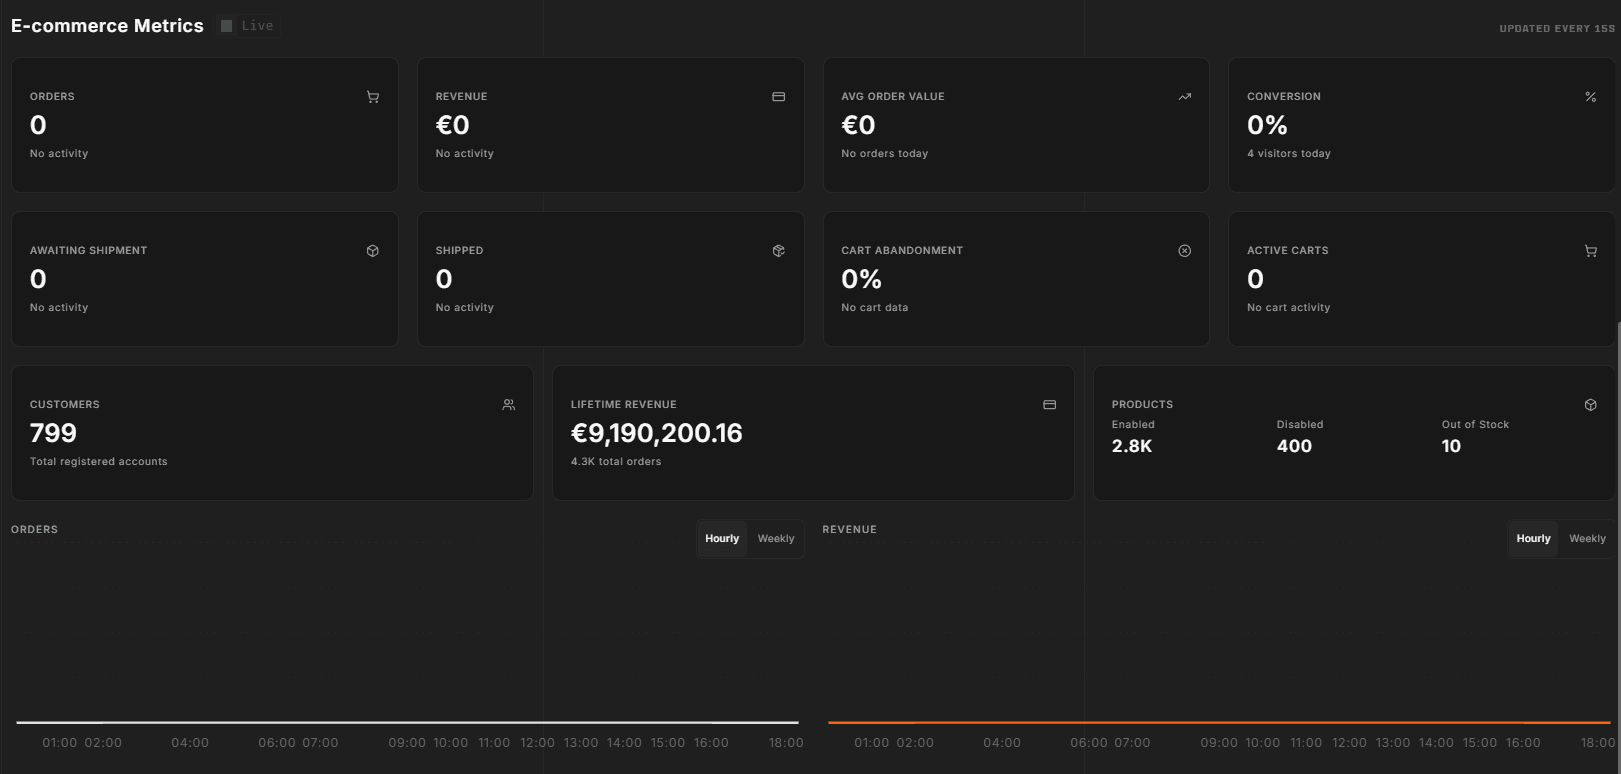
The E-commerce Metrics panel refreshes approximately every 15 seconds. It shows Magento-specific KPIs including order count, revenue, and related figures derived from the database.
Data is collected by an agent running inside the Docker stack on the environment. The agent executes scheduled scripts against the Magento database and streams the results to the Hub.
Live indicator
Both panels display a green Live badge when the WebSocket connection is healthy. If the connection drops, the badge disappears and the panel shows the last-received values until reconnection. Reconnection is automatic.
What's not here
The Overview tab is intentionally minimal — for spotting trends, not diagnosing them. When something looks off:
- Latency climbing → Traffic tab for per-request detail
- Container restart loop → Containers tab
- Failed deploy → Deployments tab
- Application errors → Logs tab for
var/log/exception.logandvar/log/system.log
Header context
The metrics panels sit beneath the environment header — name, lifecycle status badge, storefront URL, server IP, and the Store / Admin / Claude / Codeserver action buttons. The header is present on every tab, not just Overview.